At least ¼ of the investment proposals I get have a “market map” of some sort: a graphic analysis of the competitive landscape. I think competitive analysis is critical. Any useful startups is trying to perform some useful job for a client, and you have to understand what people are currently using to get that job done before you can articulate why you’re better. However, the market maps I see vary wildly in format, quality, and analytic rigor.
I’ve done some research in the past on how to find market white space, but couldn’t find any research at all specifically on how to create market maps. So, I reached out to Cornell Tech, which introduced me to a high quality team of grad students in business and computer science, who agreed that this was an interesting problem and potentially an entrepreneurial opportunity.
We collectively defined the challenge as: understanding what companies are in a given ecosystem, and how they should be positioned against each other. After interviewing a number of investors and startup founders, the team initially set out to pull in data from sources like Crunchbase and Datafox, completely automating the process of generating market maps. However, they soon discovered that the data that’s available is ill-suited to the solution.
The most common type of market map is a perceptual map: a two-dimensional diagram where the position of companies, products or brands are positioned relative to their competition. The axes are very subjective; you can’t pull in from Crunchbase how “affordable” or how “developer-friendly” a given company is, for example. What they found, though, was that the people we spoke with spent a lot of time building and modifying these maps, and were interested in how we could build a web-based solution that let them quickly pull in logos, set up the map, and save it. They began building that product, and I’d like to share with you what they’ve built. You can check out the demo and more information about the team at Marketmap.me.
Here is a demo video where the competitive landscaped for Plated, an ffVC portfolio company, is mapped out:
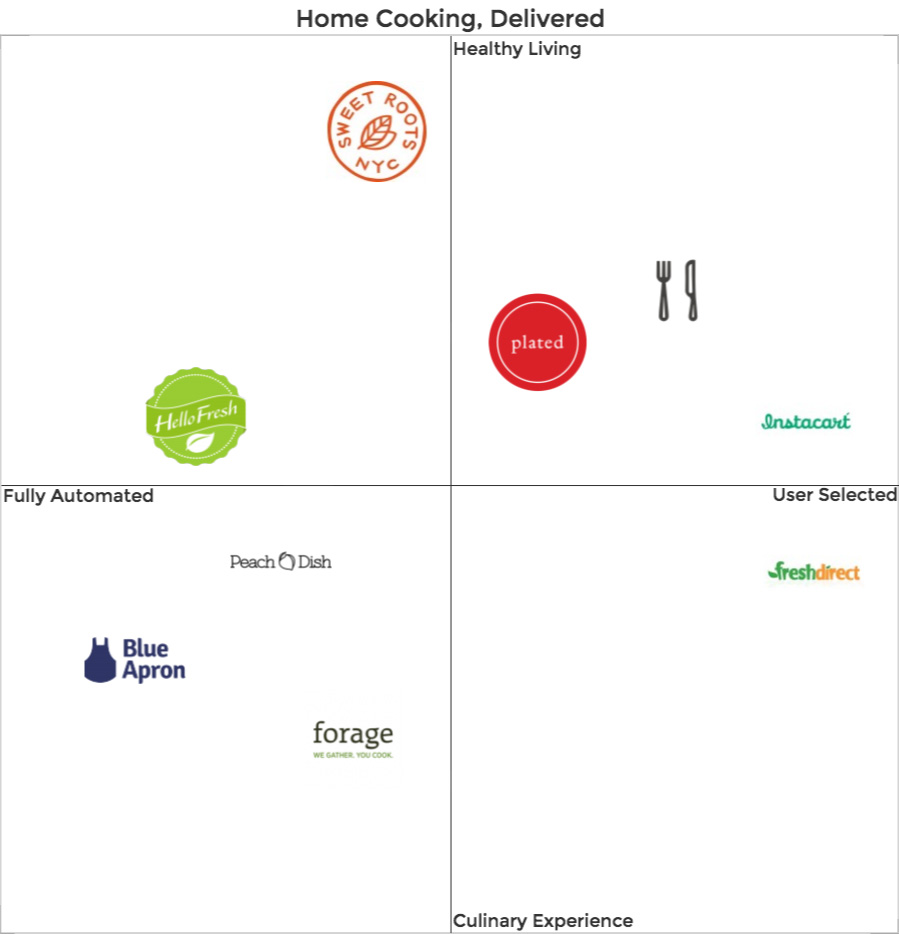
In the video, you can see how a user goes through the process of titling the map and axes, searching for companies and arranging them on the canvas, and exporting the map to a PNG file. The results of this demo can be seen here:
The marketplace for home cooked meal kits and ingredients is becoming increasingly competitive. It’s important for companies to stay aware of changes in their ecosystem and how they might adjust their positioning to better differentiate themselves. Similarly, maps such as these can inform and guide potential entrants into the space. If you were considering a similar startup and saw this map, you might consider the whitespace in the lower right and look to focus more on discrete, restaurant-quality ingredients for home chefs who like more control over their recipes.
While working on this product, the MarketMap team had another thought. As more and more users build maps, patterns in positioning will occur and this data could be used to generate insights and recommendations. Let’s say you’re building a map of the cloud storage market. You’ve set your axes and placed a few companies.
As you go to drop the next company, MarketMap looks at where other users have been placing that company along the given axis, and suggests where you might want to position it in your map.
Once we have enough data, these recommendations become more comprehensive and can provide a two dimensional heat map of where to place a given company.
In the long run, they want to think beyond simple 2D representations, and create compelling visuals that are suitable for a wide variety of applications.
Understanding your positioning within a competitive ecosystem is critical. Where do you fit in? How are you different? What does the market want that it doesn’t have?
MarketMap is building the first tool that allows startups, investors and analysts to leverage the power of a cloud-based platform and crowdsourced insight to create the most elegant, comprehensive and informative displays of competitive ecosystems.
We’d love to hear from you! Contact the team at team(@)marketmap.me with questions, ideas, or feedback. They’re particularly looking for design and engineering students who are interested and want to help build out the next version of the product, and potentially turn this into an independent real company.
The Cornell Tech MarketMap team (besides me) is:
Ben Kemper, MBA 2015 https://twitter.com/Ben_Kemper
https://www.linkedin.com/in/bkemper1
Vlad Lokshin, MBA 2015 https://twitter.com/vlokshin https://www.linkedin.com/in/vlokshin
Rachel Mayer, M.Eng 2015, https://twitter.com/waichi3 https://www.linkedin.com/in/rachelmayer3
Bryan Russett, MBA 2015, https://twitter.com/bcrussett
https://www.linkedin.com/in/bryanrussett
Lilin Wang, M.Eng 2015, https://twitter.com/lilin_wang https://www.linkedin.com/in/lilinwang


